The Clean Mobility tool allows easy access to high quality evidence and policies to manage car use, specific to different area types in the North. Information is provided on the likely level of impact on carbon and other policy areas, the strength of the evidence available, and interactions with other policies.
These policies are intended to support local decision makers in eliminating carbon emission from surface transport by 2050, and to do so in a way that provides economic, social, and health benefits.
The development of the tool involved a systematic search and review of peer-reviewed academic evidence, This review was conducted by Mott Macdonald, with expert consultation from Professor Greg Marsden (University of Leeds) and Professor Glenn Lyons (UWE Bristol). A report on the methodology and outcomes of this process is available here. This tool presents the results of process, and combined this with modelled outputs from TfN’s Analytical Framework.
Use the toolManaging car use is a necessary part of achieving the North’s commitments to surface transport by 2045, and remaining within the total carbon budgets set by the Climate Change Committee and TfN’s Decarbonisation Strategy. These reductions are particularly important between now and 2030,
when most car trips in the North are expected to still be made by petrol and diesel cars.
As well as climate change, managing car use and reducing levels of car dependency are also important in supporting the other strategic ambitions within our STP around reducing transport related social exclusion in the North and driving economic productivity.use also connects to a number of other key policy challenges. Under a vehicle-led approach to decarbonisation scenario, time lost to traffic congestion across England is forecast to increase by 32% by 2050. As well as causing significant economic damage, this will have adverse impacts on health, wellbeing, and social inequality.
However, these significant increases in levels of car use are not inevitable, and the decarbonisation of the transport system offers significant opportunity for change. This tool provides decision-makers with evidence-based policies for reducing carbon emissions, reducing congestion, supporting local economies, and improving health and social outcomes.

Effectively managing levels of car use in the North requires different policies and interventions in different places – one size does not fit all.
Our tool provides policy solutions for five different area types, based on the rural-urban classification developed by the Office for National Statistics, and adapted to reflect the context in the North.
The most sparsely populated areas, with the longest travel times to key destinations, but with the lowest average levels of poverty and deprivation. This includes significant areas of rural Lancashire, Cumbria, Northumberland, and North Yorkshire.
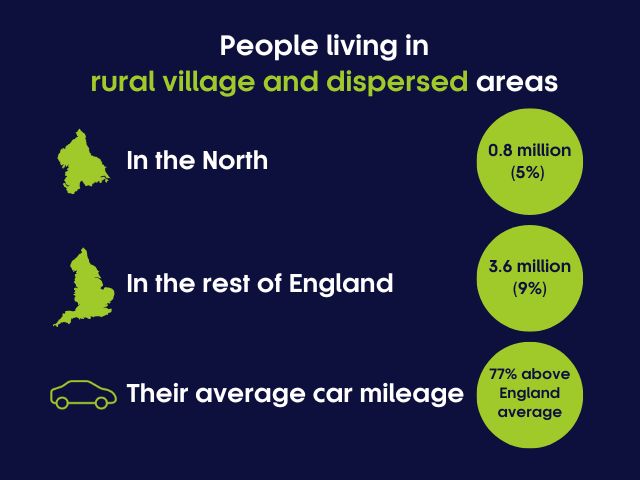
Rural villages and towns of a range of sizes, including those on the fringes of urban areas. Typically characterised by poor public transport access to key destinations, often coinciding with higher levels of poverty and deprivation. Examples include Selby, Hyndburn, Darwen, and Sefton.
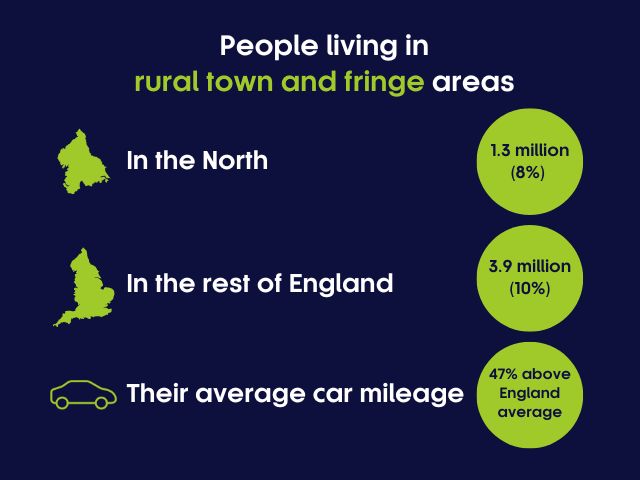
Larger towns and smaller cities with a significant urban and suburban populations. Public transport access to key destinations is varied, particularly outside of the urban core area. Examples include Darlington, Warrington, York, Carlisle, and Lancaster.
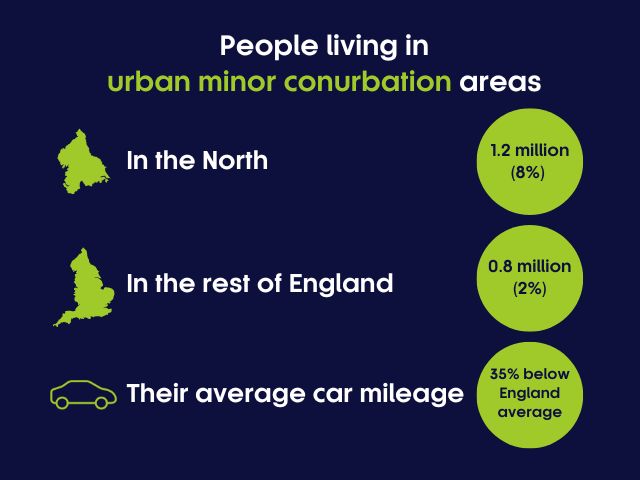
Smaller metropolitan areas, comprised of multiple urban centres, and some more rural outlying areas. Public transport access to key destinations is varied, particularly outside of the urban core area. Barnsley, Doncaster, Rotherham, and Sheffield are the only areas of this type in the North.
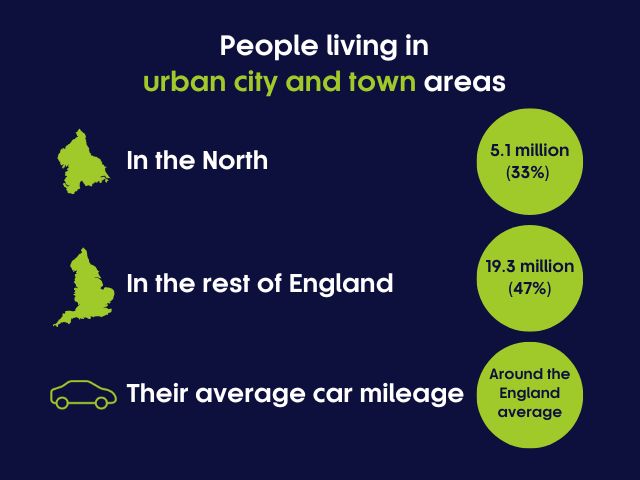
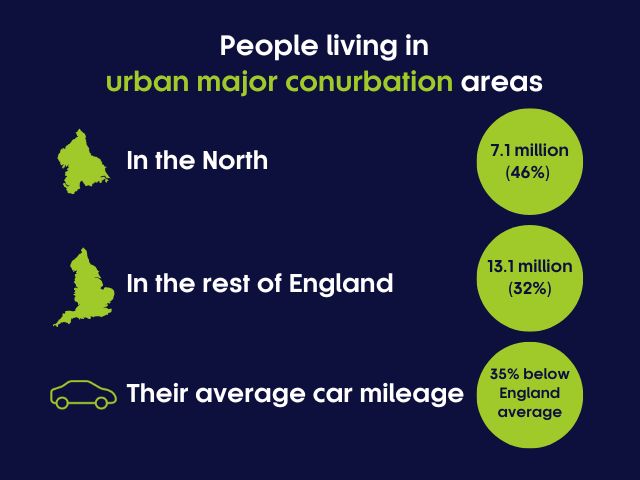
Larger metropolitan areas, comprised of multiple urban centres, and some more rural outlying areas. This includes Greater Manchester, Leeds and Bradford, Liverpool and Merseyside, and Newcastle, Gateshead, and Tyneside. Public transport accessibility is varied across these large areas, but is significantly higher than average.
TfN wants to enable Local Authorities and other stakeholders to achieve significant carbon reductions, alongside economic, health, and social benefits. The tool supports this by providing direct access to clear and rigorous evidence on the range of policies that can manage levels of car use.
This tool fulfils a number of actions from TfN’s Decarbonisation Strategy, which sets the regional trajectory to achieve close to zero carbon emissions from surface transport by 2045. This Strategy is subject to public consultation and agreement by TfN’s Board.
Alongside Clean Mobility, TfN is working to support the transition to electric vehicles, the development of hydrogen technologies, and mode shift in freight transport.
Our Decarbonisation StrategyIf you have any questions about the Clean Mobility tool, including how to interpret or implement the evidence presented in the tool or to recommend new evidence to be included in the tool, please email [email protected].
Contact us

Our Transport Decarbonisation Strategy is the culmination of efforts from TfN and our partners across the North to create the tools, capability and evidence that will help sha
CLOSE POPUP [X]